Most modern engineering organizations run multiple SCA tools across lots of repositories, each with its format, rules, sensitivity, and blind spots. The hard problem they face today is deciding which findings matter in their context quickly, without moving sensitive code or adding yet another place to check. Static rules unfortunately often lack this necessary granularity to differentiate between actual issues and noise. We are building something that does better!
Konvu is built to decide, not just list. Sensors live next to code and services and pull the smallest slice of context needed to judge a finding. We decided on an agentic approach so the system can autonomously gather evidence, test relevance, check whether something is actually exploitable, and then record a decision with a clear rationale. Only the minimum evidence leaves the boundary, and the results are written back to the systems teams are already using.
The challenge of vulnerabitlity triage
Konvu’s agentic approach
An agent, in the classical sense, is a tool calling loop that can plan, invoke tools, and use their outputs to refine its next step. Our system uses multiple sub-agents inside our static sensor. They only ever run read-only on copies of the source and send only the minimum inputs needed for inference to keep reasoning focused and to limit exposure. Each looks at a different slice of the qualification, then a concluding agent reviews their findings, runs any extra checks, and records the decision with tangible evidence. Inputs include the source code and the original security finding, plus enriched context from our vulnerability database.
Strong Boundaries by Design
The static sensor runs at your data and privacy boundary. Many teams host it in their own infrastructure so source and internal context never leave the perimeter. When a managed option is better for you, we run the same sensor in a dedicated, isolated AWS account. Jobs are share-nothing. Volatile credentials are pulled just in time from the job queue. Results are only centralized through our public API. Logs stay inside that isolated account.
The outcome is the same in both modes: investigate as close to your context as possible, then centralize only the decision and the minimal proof required to support it.
Static Meets Runtime
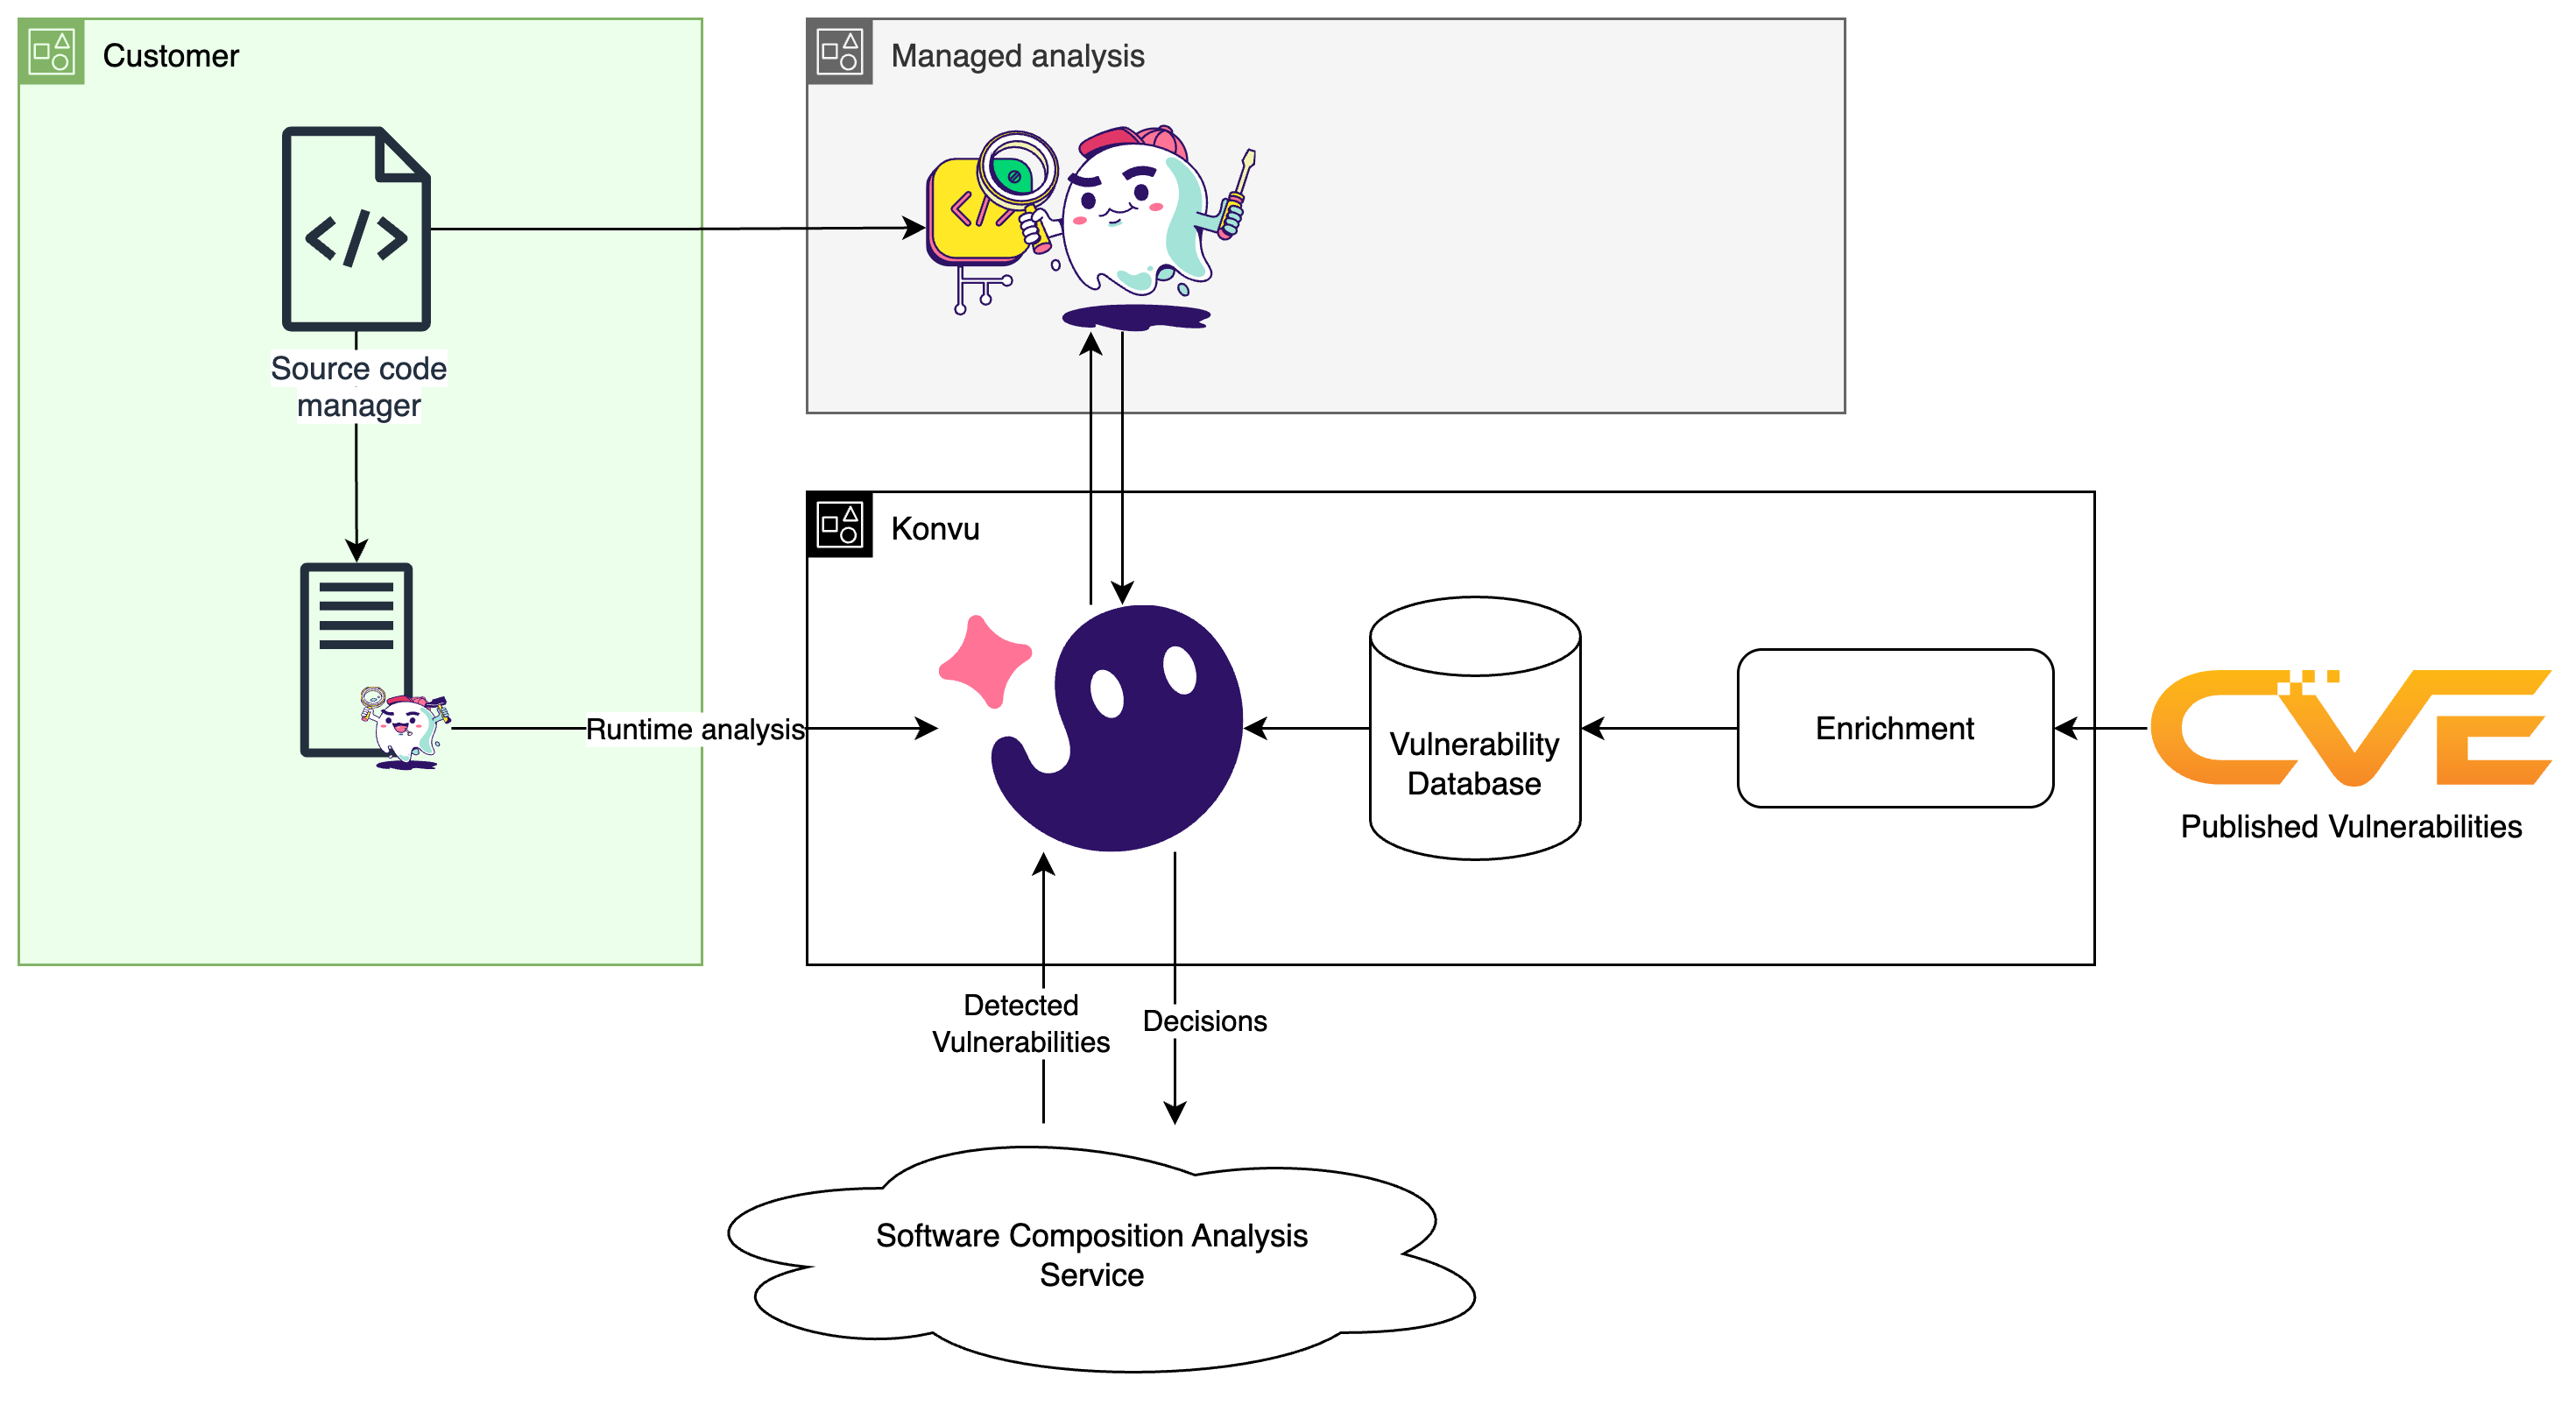
Whenever a new SCA finding arrives, Konvu triggers an analysis. The static sensor is executed on a fresh copy from your source code manager in customer-hosted or Konvu-managed mode. It is the exact same sensor in both cases. It produces a result that is sent over the wire, and any analysis artifacts are cleaned up.
Some questions only a running program can answer absolutely. So we do provide an optional runtime sensor. It can be injected using a Kubernetes admission controller so that it starts with the workload and is painless to deploy. It is language native and adheres to a simple principle: minimize work on hot code paths to ensure peak performance. It emits structured runtime reachability and relevance signals that then enable us to refine our final recommendation.
At the center of the web, Konvu consolidates sensor outputs, orchestrates overall analysis and publishes final decisions. The goal is to produce a decision that states whether a finding is real in this codebase, why it matters now, and whether you should act. That decision is written back to your SCA service, your ASPM, or to the issue tracker your teams already use, so action happens where work already lives.
The Enriched Vulnerability Database
This relies on our own enriched vulnerability database. It continuously ingests newly published advisories, then normalizes and deduplicates them before enrichment. Each CVE is enriched with detailed exploitability conditions that are provided to the different agents. They are augmented by a combination of AI agents, established software analysis techniques, and human review, producing a single, queryable record per issue. That consistency gives sensors and agents the same context every time, so decisions are repeatable and easy to audit.
The Tech Stack That Runs It All
Now for the practical side. Here is how we run day to day and the stack that powers it. On the infrastructure side, we run our staging and production on AWS EKS with underlying resources defined in Terraform. Analysis results are stored in PostgreSQL accessed by our backend services.
The central control plane itself is Python with FastAPI and Pydantic, which provides typed request and response models and OpenAPI schemas by default. These contracts also generate frontend types so the backend, UI, and sensors stay aligned. The UI is built in React with TypeScript and Mantine to ease development across layers. The static sensor ships as a Go binary so that it is straightforward to run in customer environments. It's then easily embeddable in dedicated Docker images, CI actions, or any VM. Runtime sensors are written in the language they instrument, so they fit naturally into services. Finally, for local work, engineers can easily bring up the full product through Docker Compose to reproduce production layout quickly.
What’s Next: From Decide to Fix
What comes next follows the same shape. We are pushing on more efficient on premises operations while keeping boundaries strong and mental models simple. On the product side we are continuously improving accuracy and integrating cleanly with more SCA, SCM, and ASPM systems. We're also laying the rails for the next step: deeper remediation, moving from "decide" to "fix" with context-aware helpers wherever they could genuinely save even more time.
Join us!
We are small enough that you can touch most of this stack and large enough in ambition that there is real scale to earn. The problems are concrete, the challenges are interesting, and the feedback loops are short. If you want to analyze where code lives, make decisions once, and keep operational toil intentionally minimal so the product can be sharp, while having lots of fun, we'd love to talk.
Check out our open positions at our careers page.